GDB Debugger#
1. Introduction#
In a nutshell
Developed in 1986 by Richard Stallman at MIT.
Current official maintainers come from RedHat, AdaCore, and Google.
Significant contribution from the open source community.
Brief technical details
Allows programmers to see inside and interact/modify with all components of a programs, including information inside the registers.
Allows programmers to walk through the program step by step, including down to instruction level, to debug the program.
Cheatsheet
Study this cheatsheet
Developed by Dr. Doeppner at Brown University.
Become very comfortable with terminal!
2. tmux#
Introduction
Our workspace is limited within the scope of a single terminal (a single shell) to interact with the operating system.
tmux: terminal multiplexer.tmuxallows user to open multiple terminals and organize split-views (panes) within these terminals within a single original terminal.We can run/keep track off multiple programs within a single terminal.
Beginning with tmux
SSH into
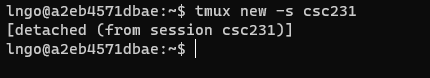
mollyStart new with a session name:
tmux new -s csc231
You are now in the new tmux session.
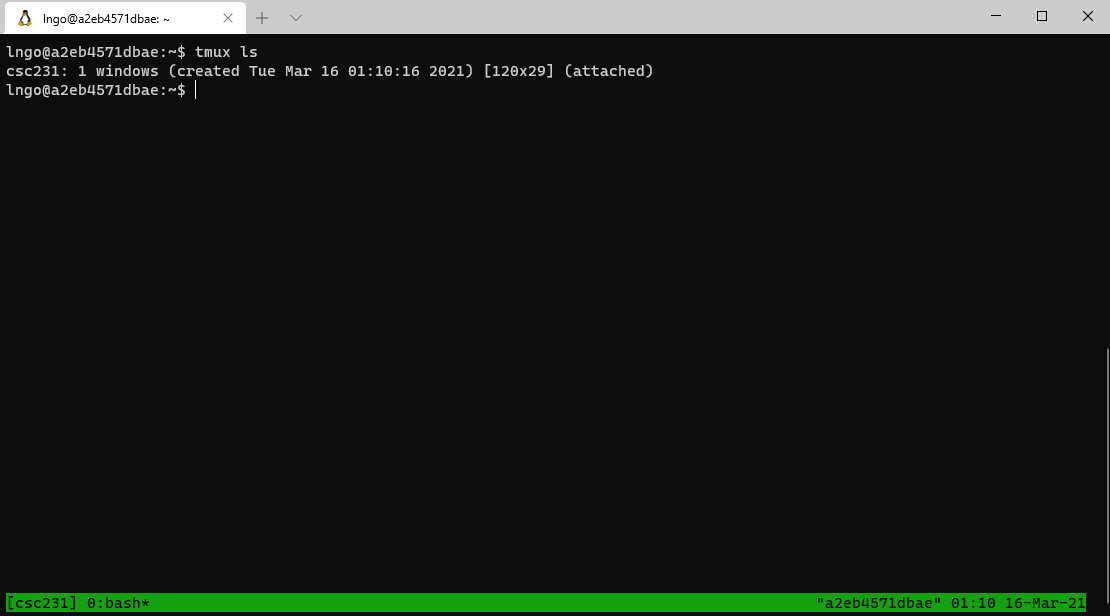
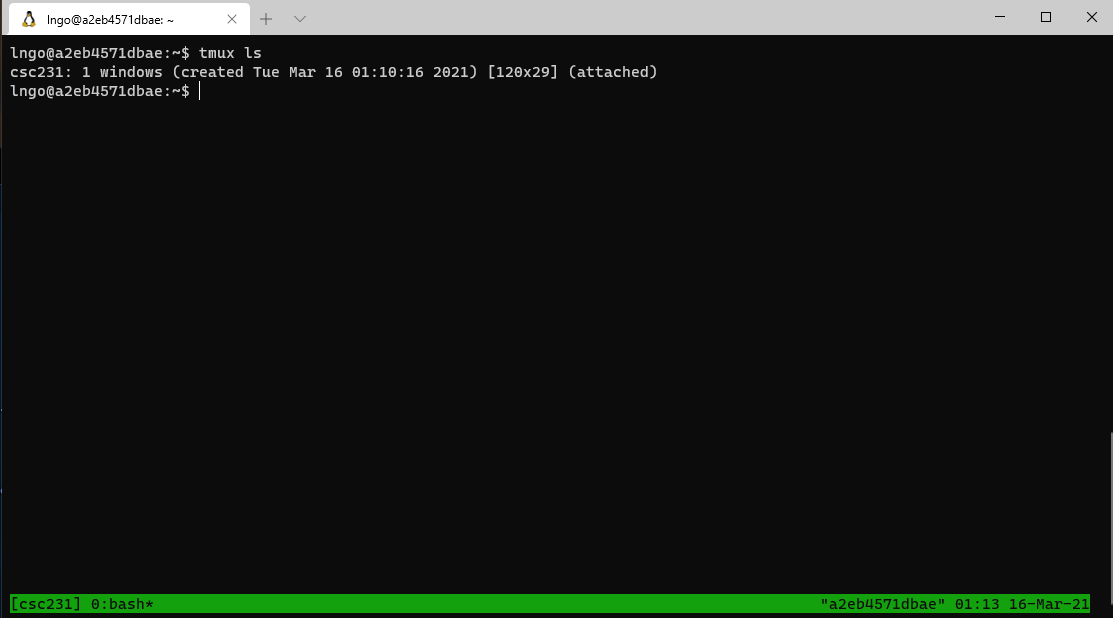
You can list all active tmux sessions.
tmux ls
Notation: Key press combinations connected with a single dash (
-) means to be pressed together, otherwise, it means lift your finger, then press ….To go back to the main terminal, press
Ctrl-b, then pressd.
To go back into the
csc231session:tmux attach-session -t csc231.
To kill a session:
From inside the session:
exit, orFrom outside the session:
tmux kill-session -t csc231
By the end of this slide your should exit out/terminate the
csc231tmux session.Be careful to not exit out of molly altogether.
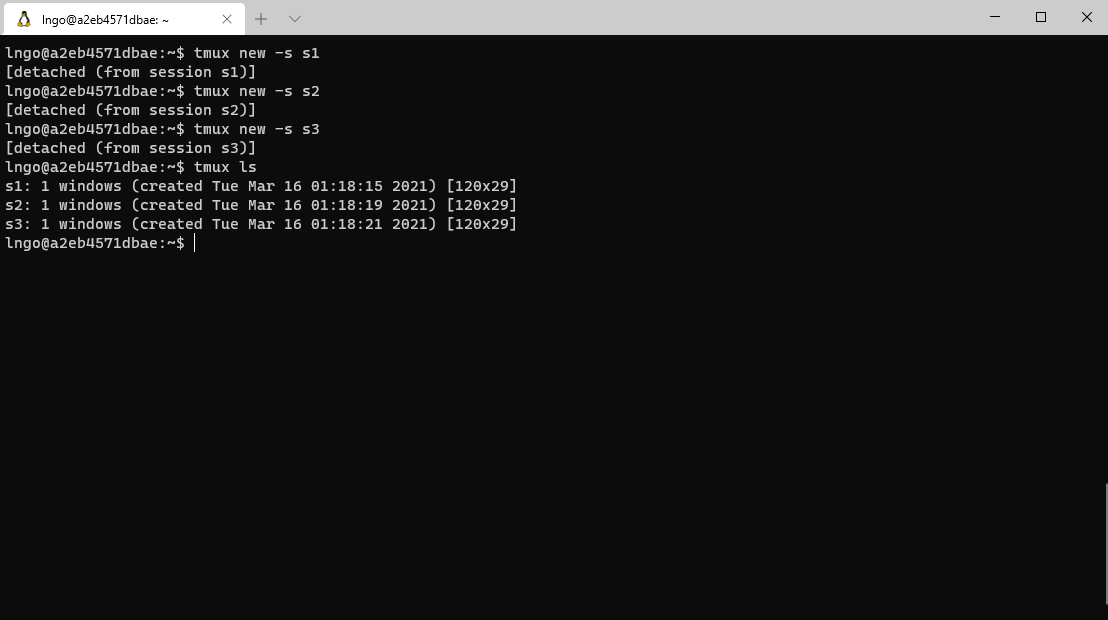
Hands on: navigating among multiple tmux sessions
Run
tmux lsto check andtmux kill-sessionto clean up all existing tmux sessions.Create a new session called
s1.Detach from
s1and go back to the main terminal.Create a second session called
s2.Detach from
s2, go back to the main terminal, and create a third session calleds3.Use
tmux lsto view the list of tmux sessions.Navigate back and forth between the three sessions several times.
Kill all three sessions using only
exit!
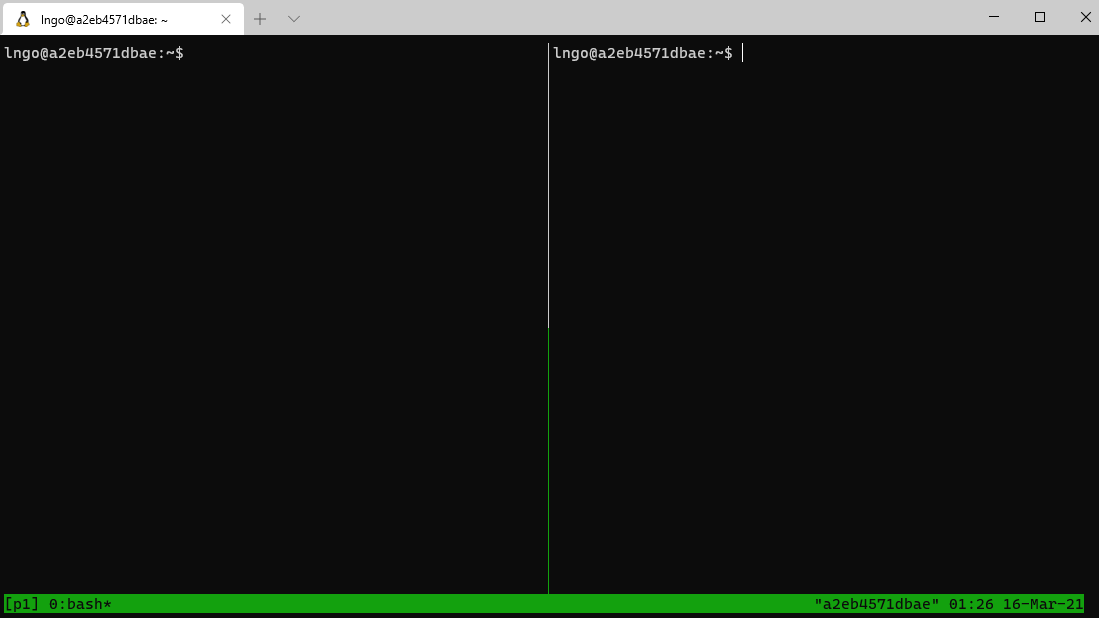
Multiple panes in tmux
Create a new session called
p1.
tmux new -s p1
Splits terminal into vertical panels:
Ctrl-bthenShift-5(technical documents often write this asCtrl-band%).
Splits terminal (the current pane) into horizontal panels:
Ctrl-bthenShift-'( technical documents often write this asCtrl-band").
Toggle between panels:
Ctrl-bthenSpace.To move from one panel to other directionally:
Ctrl-bthen the corresponding arrow key.Typing
exitwill close the pane with the activate cursor.Run
exitmultiple times to completely close out thep1session. Pay attention to not get out of the container.
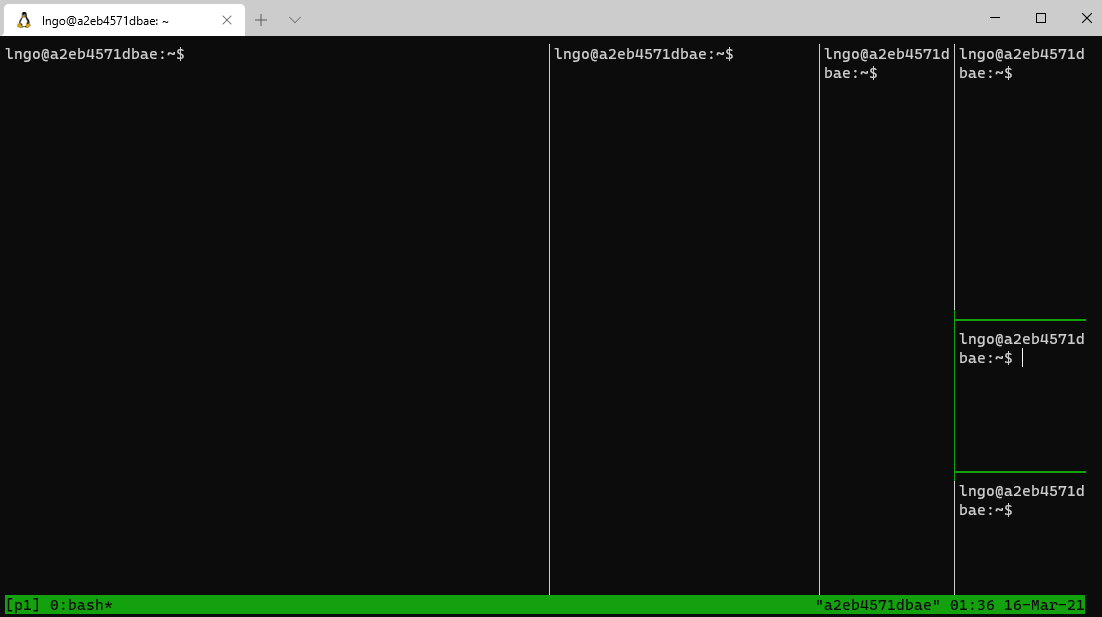
Hands on: creating multiple panes
Run
tmux lsto check andtmux kill-sessionto clean up all existing tmux sessions.Create a new session called
p1.Organize
p1such that:p1has four vertical panes.The last vertical pane of
p1has three internal horizontal panes.
Kill all panes using
exit!
Resizing panels
What we did in the previous hands-on was not quite usable.
We need to be able to adjust the panes to the proper sizes.
This can be done by issuing additional commands via tmux’s command line terminal.
Run
tmux lsto check andtmux kill-sessionto clean up all existing tmux sessions.Create a new session called
p1.Split the session horizontally.
Windows:
You can adjust the size of two adjacent horizontal panes by press and hold
Ctrl-bthen the left/right arrows.You can adjust the size of two adjacent vertical panes by press and hold
Ctrl-bthen the up/down arrows.
Mac and Windows:
Press
Ctrl-bthenShift-;to open up the command line bar at the bottom. Type in:rezise-pane -U 20then pressEnterto move the horitontal bar up 20 pixelsrezise-pane -D 20then pressEnterto move the horitontal bar down 20 pixelsrezise-pane -L 20then pressEnterto move the vertical bar left 20 pixelsrezise-pane -R 20then pressEnterto move the vertical bar right 20 pixels
You can adjust the number for aesthetic purpose.
Challenge
Redo the hands-on activity of slide 8 so that all the panes are aesthetically proportional.
After complete, finish and exit out of all tmux sessions
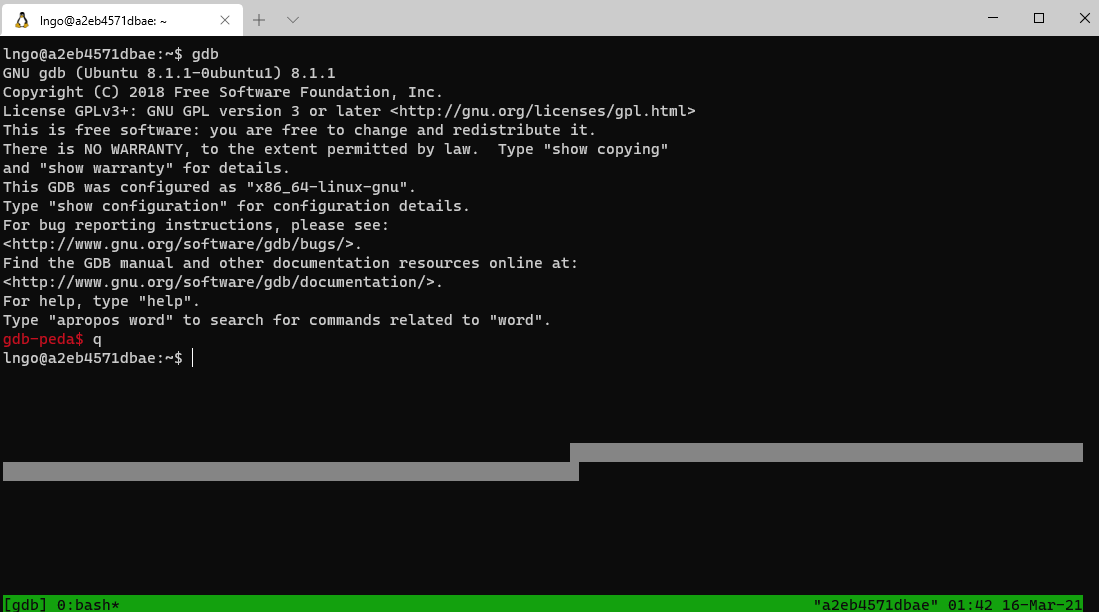
3. Running and exiting gdb#
Setup pretty gdb
Create a new tmux session called
gdb.Run the following command in the
gdbsession.
cd
git clone https://github.com/longld/peda.git
echo "source $HOME/peda/peda.py" > $HOME/.gdbinit
gdb
To exit from gdb type
qand hitEnter.
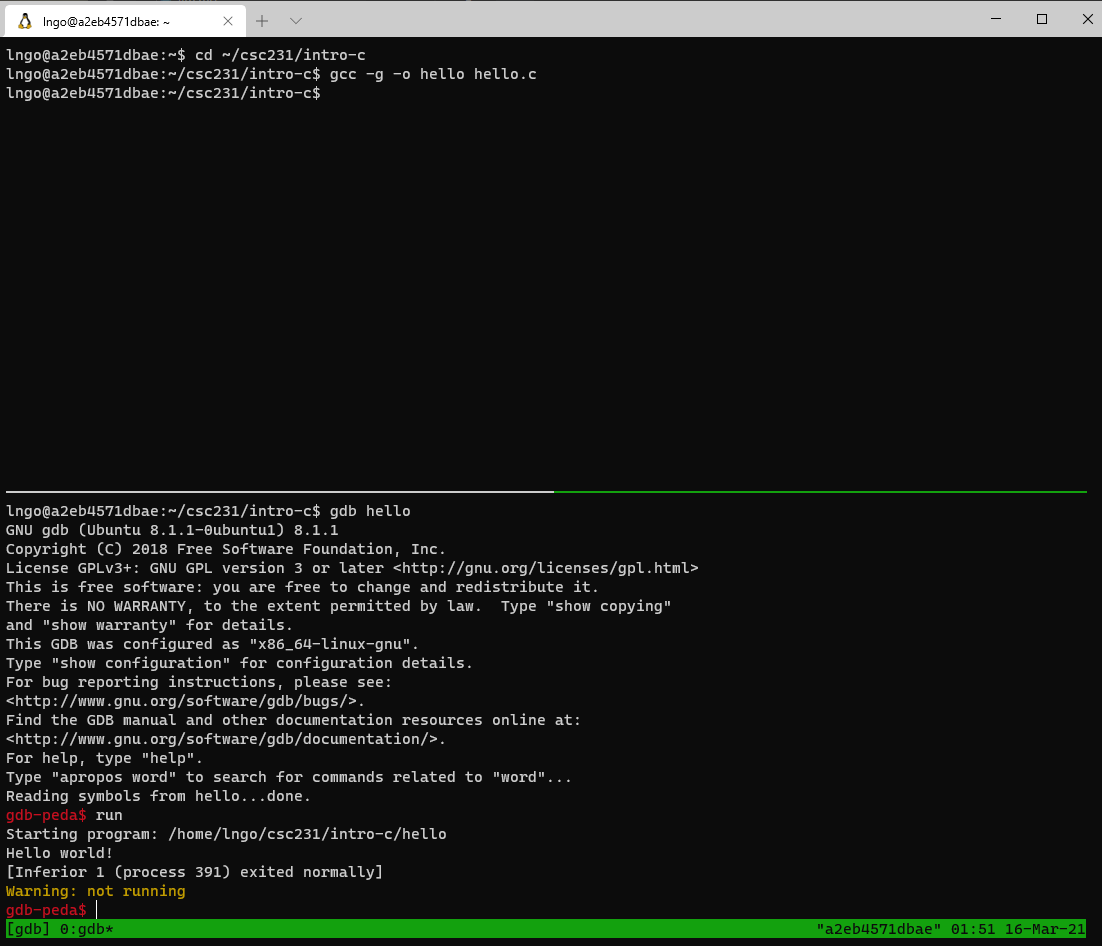
Setup an application with gdb
To use
gdbto debug, we need to compile the program with a-gflag.Split the
gdbsession into two horizontal panes.In the top pane, run the followings command:
cd ~/csc231/intro-c
gcc -g -o hello hello.c
In the bottom pane, run the followings command:
cd ~/intro-c
gdb hello
gdb-peda$ run
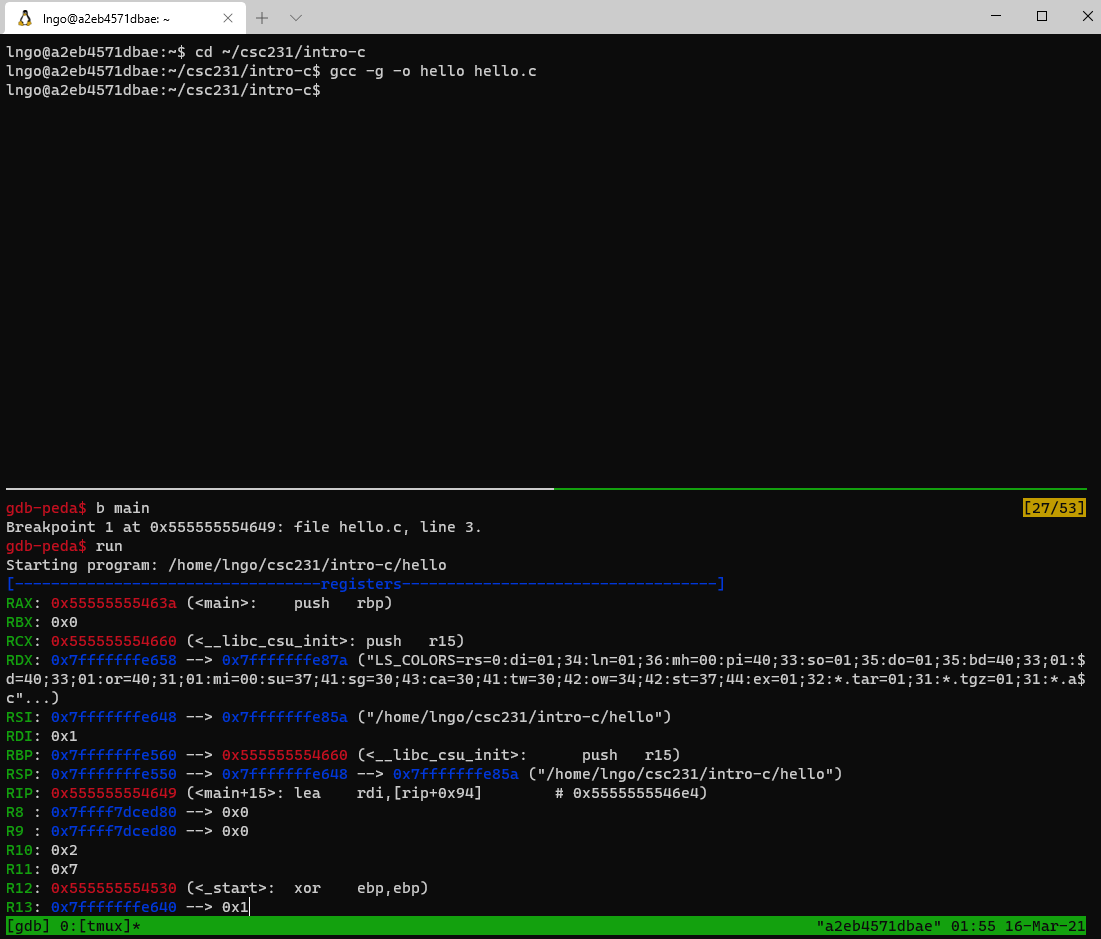
Debugging with gdb
This is a continue from the previous slide’s tmux windows
We need to set a
breakpoint:Could be a line number or
Could be a function name
gdb-peda$ b main
gdb-peda$ run
Scrolling within tmux’s panes
Mouse scrolling does not work with tmux.
To enable scrolling mode in tmux, type
Ctr-bthen[.You can use the
Up/Down/PgUp/PgDnkeys to navigate.To quit scrolling mode, type
qorEsc.
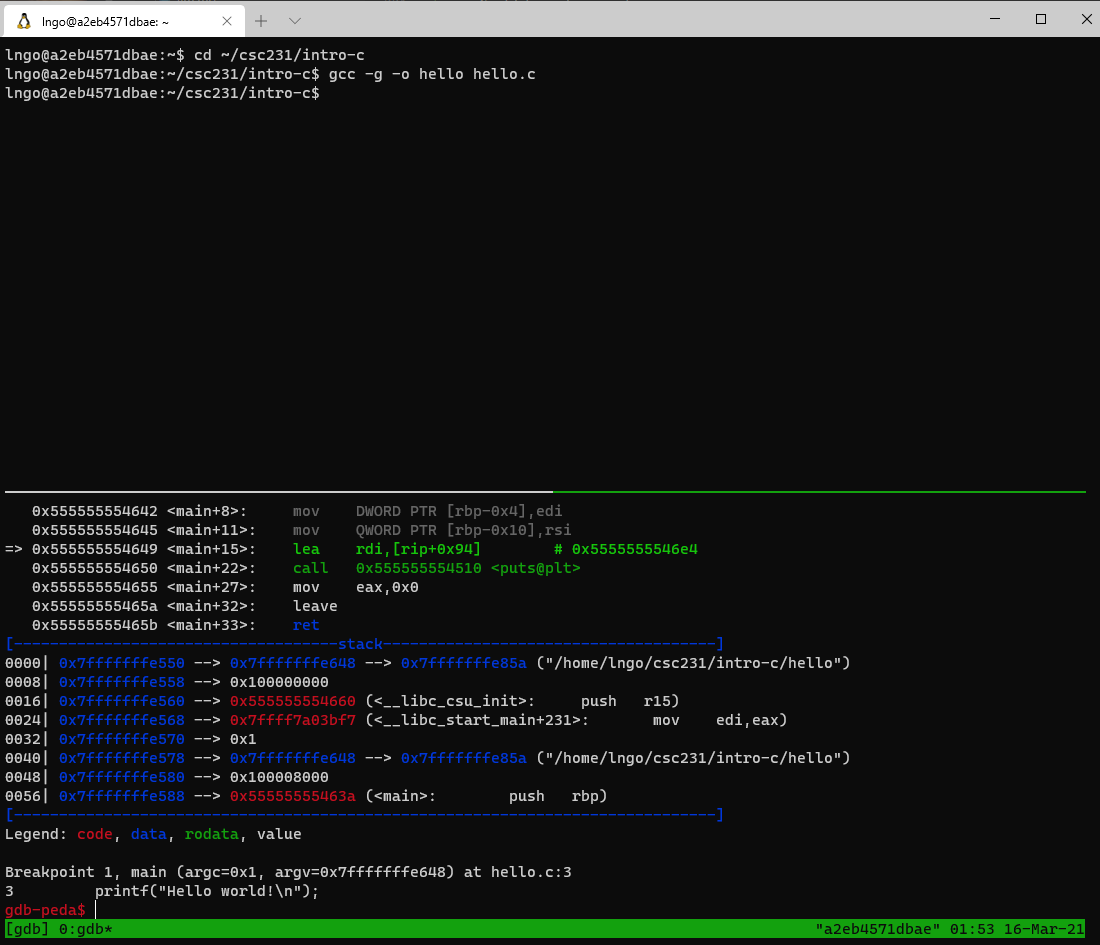
At a glance
Registers’ contents
Code
Stack contents
Assembly codes
gdbstops at our breakpoint, just before functionmain.The last line (before the
gdb-peda$prompt) indicates the next line of C code to be executed.
Hands on: finish running hello
Type
qorEscto quit scrolling mode.To continue executing the next line of code, type
nthenEnter.Turn back into the scrolling mode and scroll back up to observe what happens after typing
n.What is the next line of code to be executed?
Type
nthree more times to observe the line of codes being executed and the final warning fromgdb.Type
qto exit fromgdb.
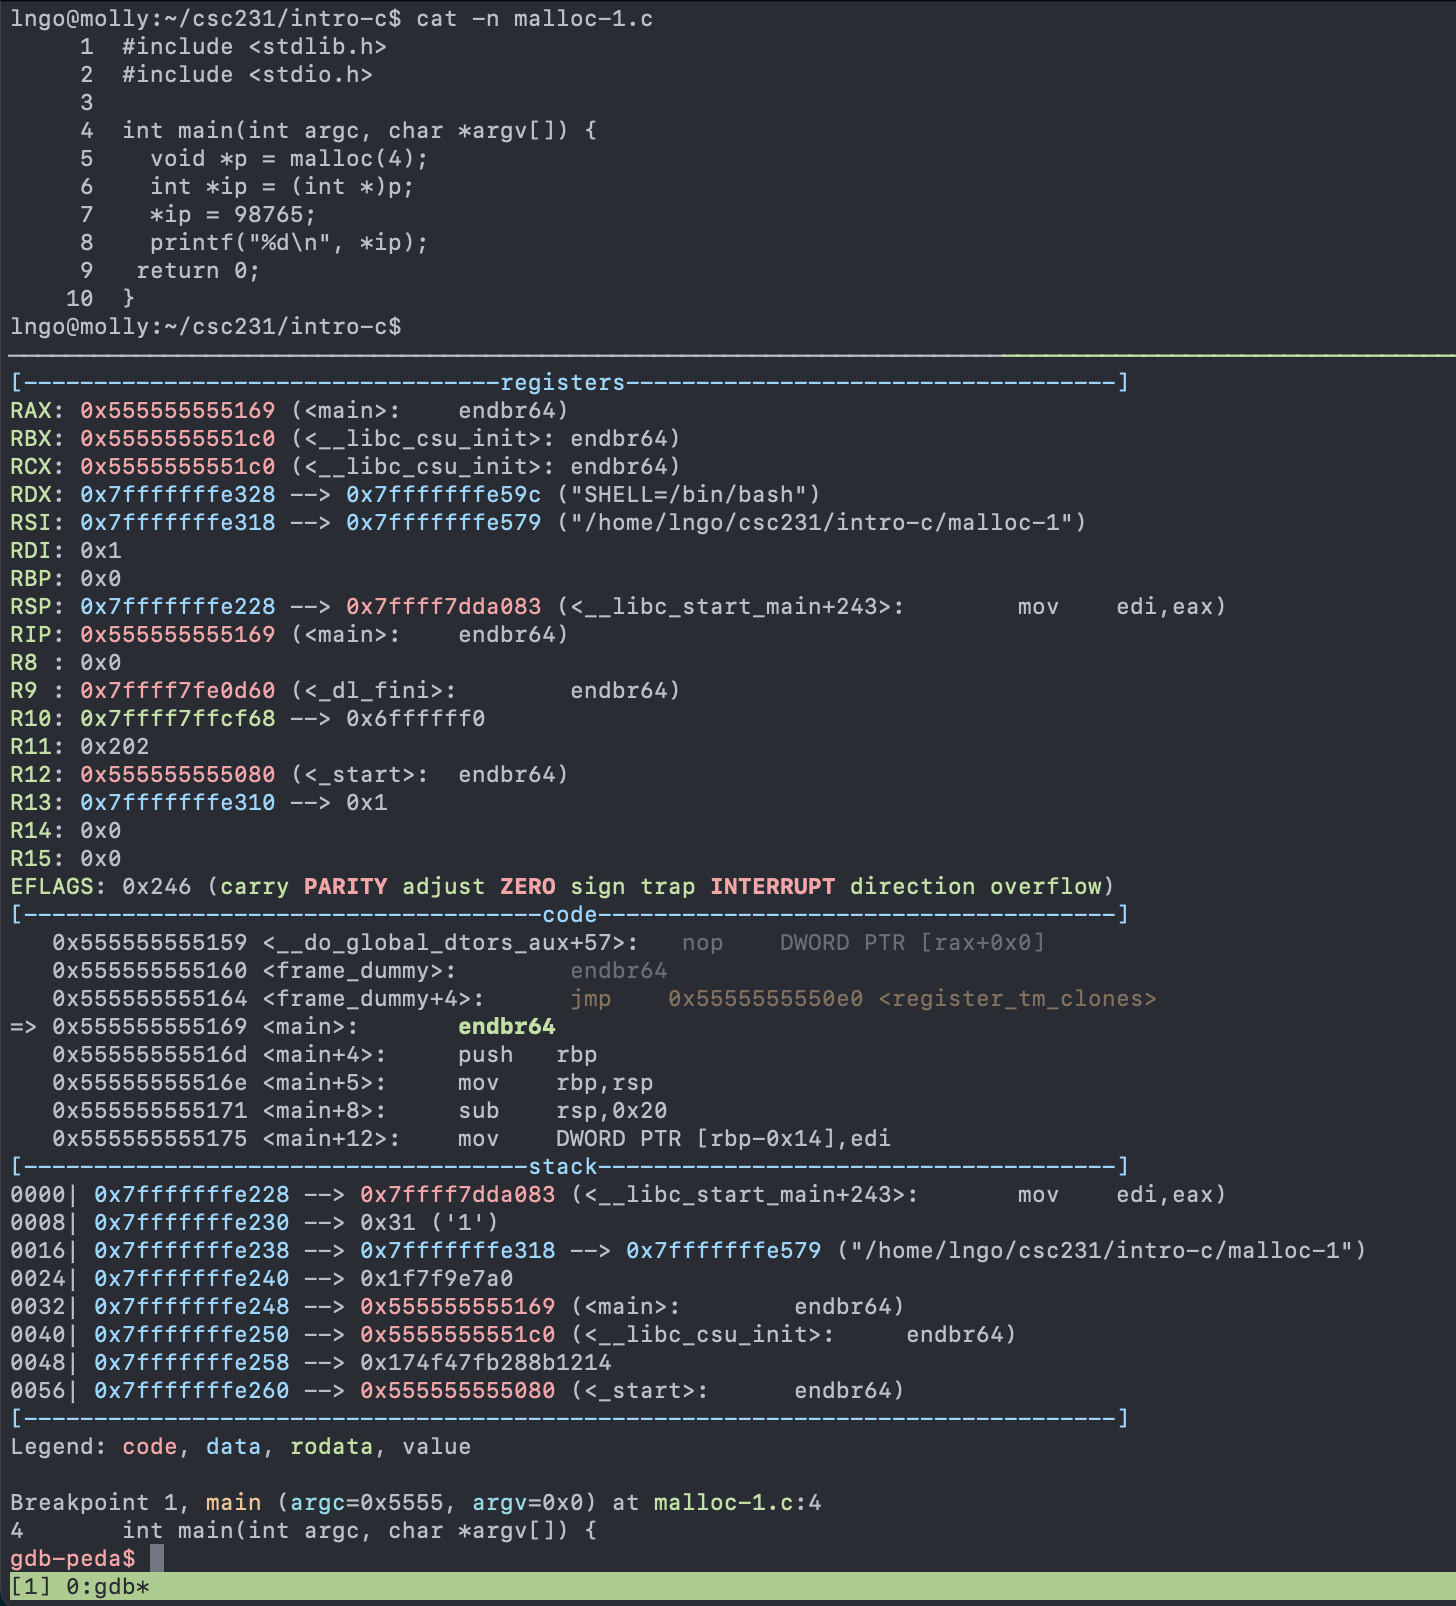
Examining contents of program while debugging malloc-1.c
This slide should start in a two-horizontal-panel tmux session
Change to the directory containing your
malloc-1.cthat was created from the previous lectures. If you don’t have it, create a newmalloc-1.cwith the code below
In the top pane, compile
malloc-1.cin debugging mode.
gcc -g -o malloc-1 malloc-1.c
cat -n malloc-1.c
Adjust the top/bottom panes proportion as needed.
In the bottom pane, quit the current gdb session and rerun it on the recently created
malloc-1executable.Setup
mainas thebreakpointand start running.
gdb malloc-1
gdb-peda$ b main
gdb-peda$ run
After initial run command
Type
nandEnterto run the next line of code:int main(int argc, char *argv[]) {Type
p p: the firstpis short forprintand the secondpis the void pointer variablepin the program.Try running
p *p. What does that feedback mean?
After running int main(int argc, char *argv[]) {
![After running int main(int argc, char *argv[]) {](../_images/malloc-02.png)
Type
nandEnterto run the next line of code:void *p = malloc(4);Type
p pthenp *pagain.Why do we have the change in value of
p?Why doesn’t value of
*pchange?
After running void *p = malloc(4);
Type
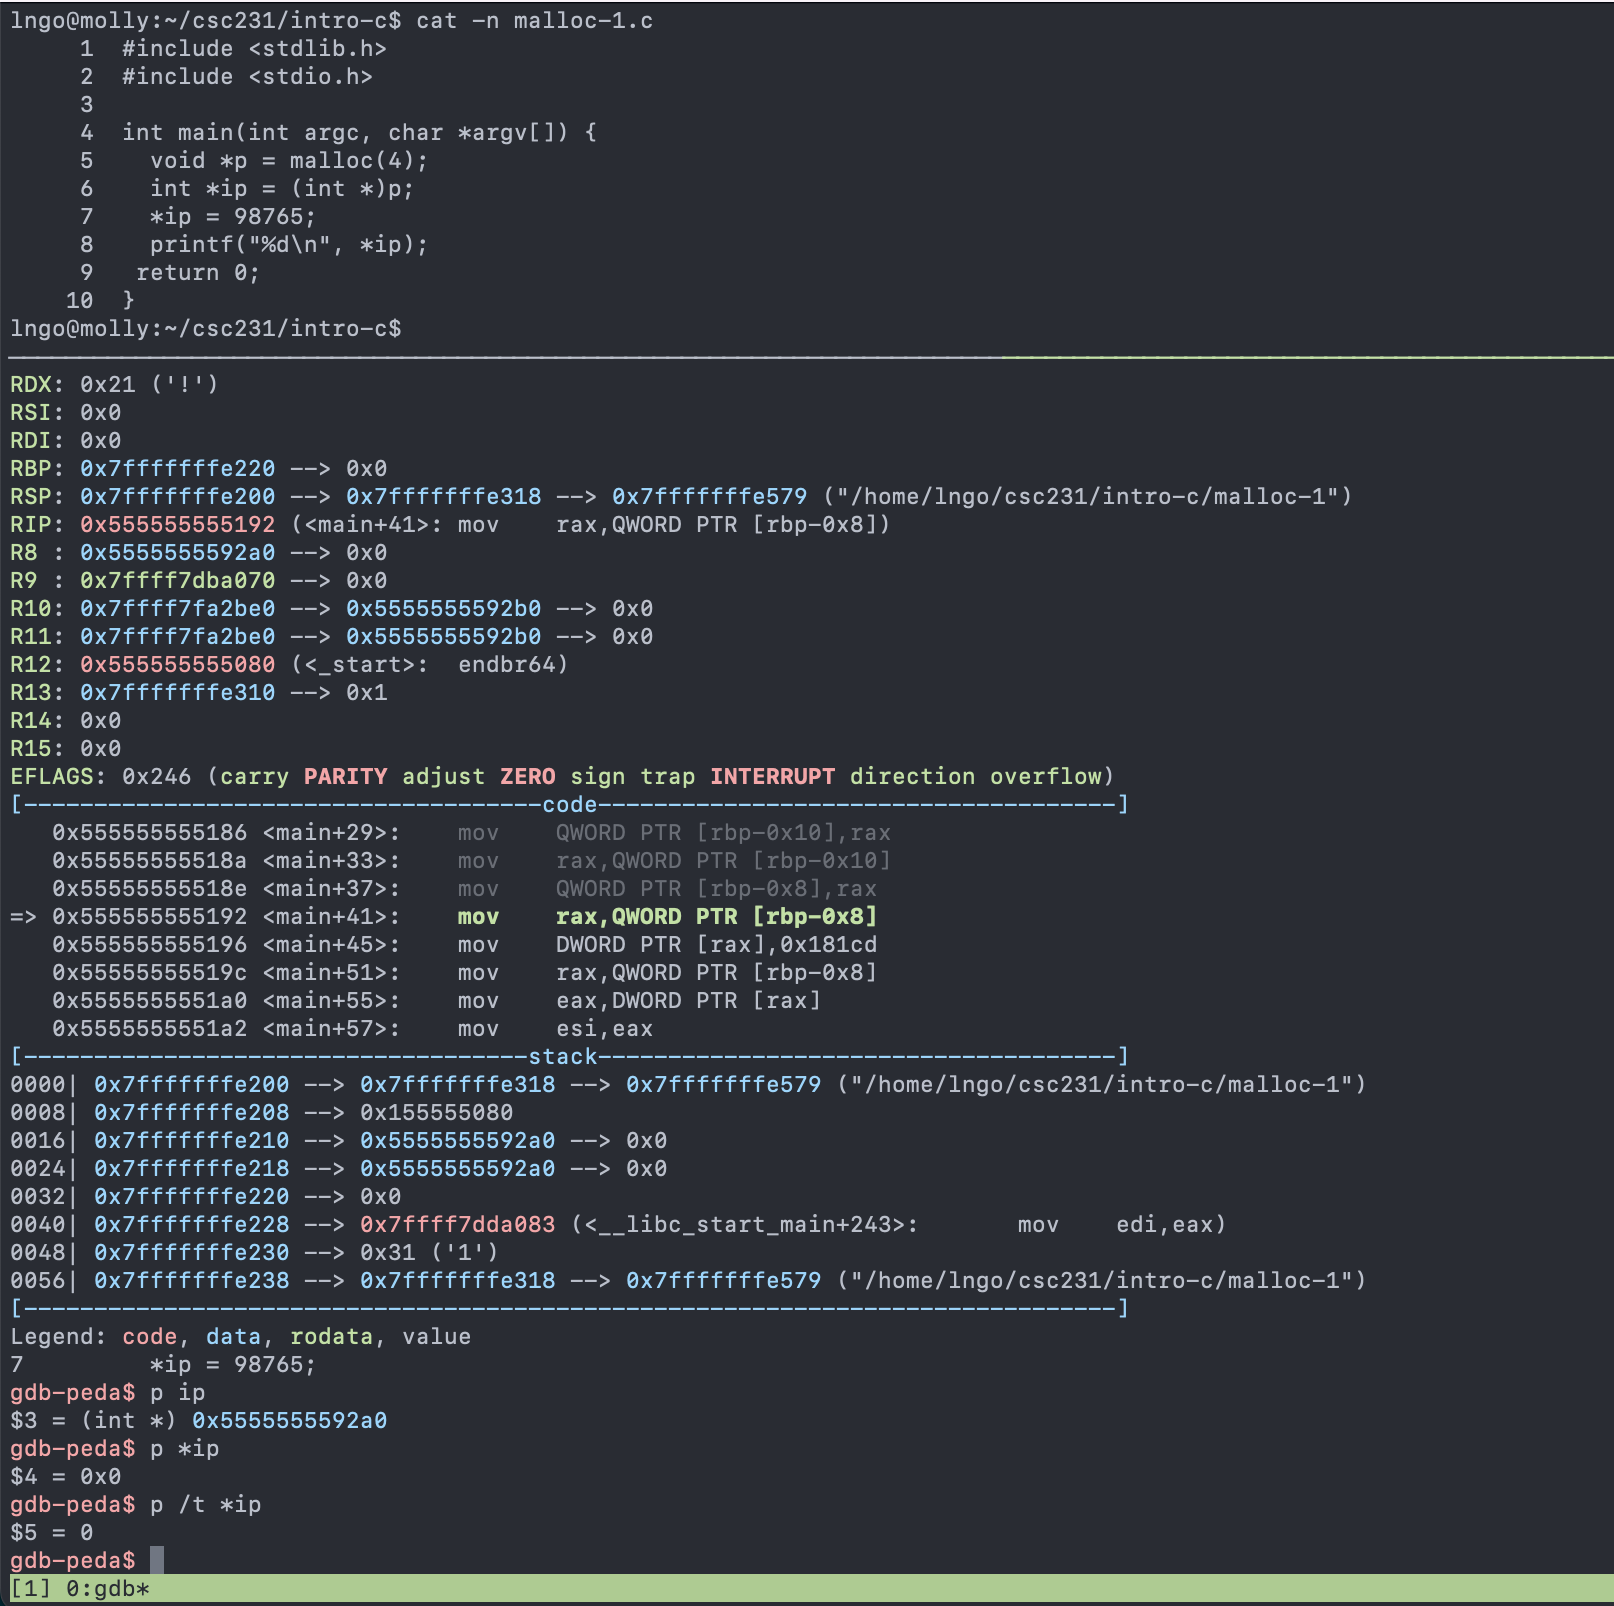
nandEnterto run the next line of code:int *ip = (int *)p;Type
p ip: what is the printed value?Type
p *ip: what is the printed value?Type
p /t *ip: what type of data is value? what is the corresponding value in decimal?
After running int *ip = (int *)p;
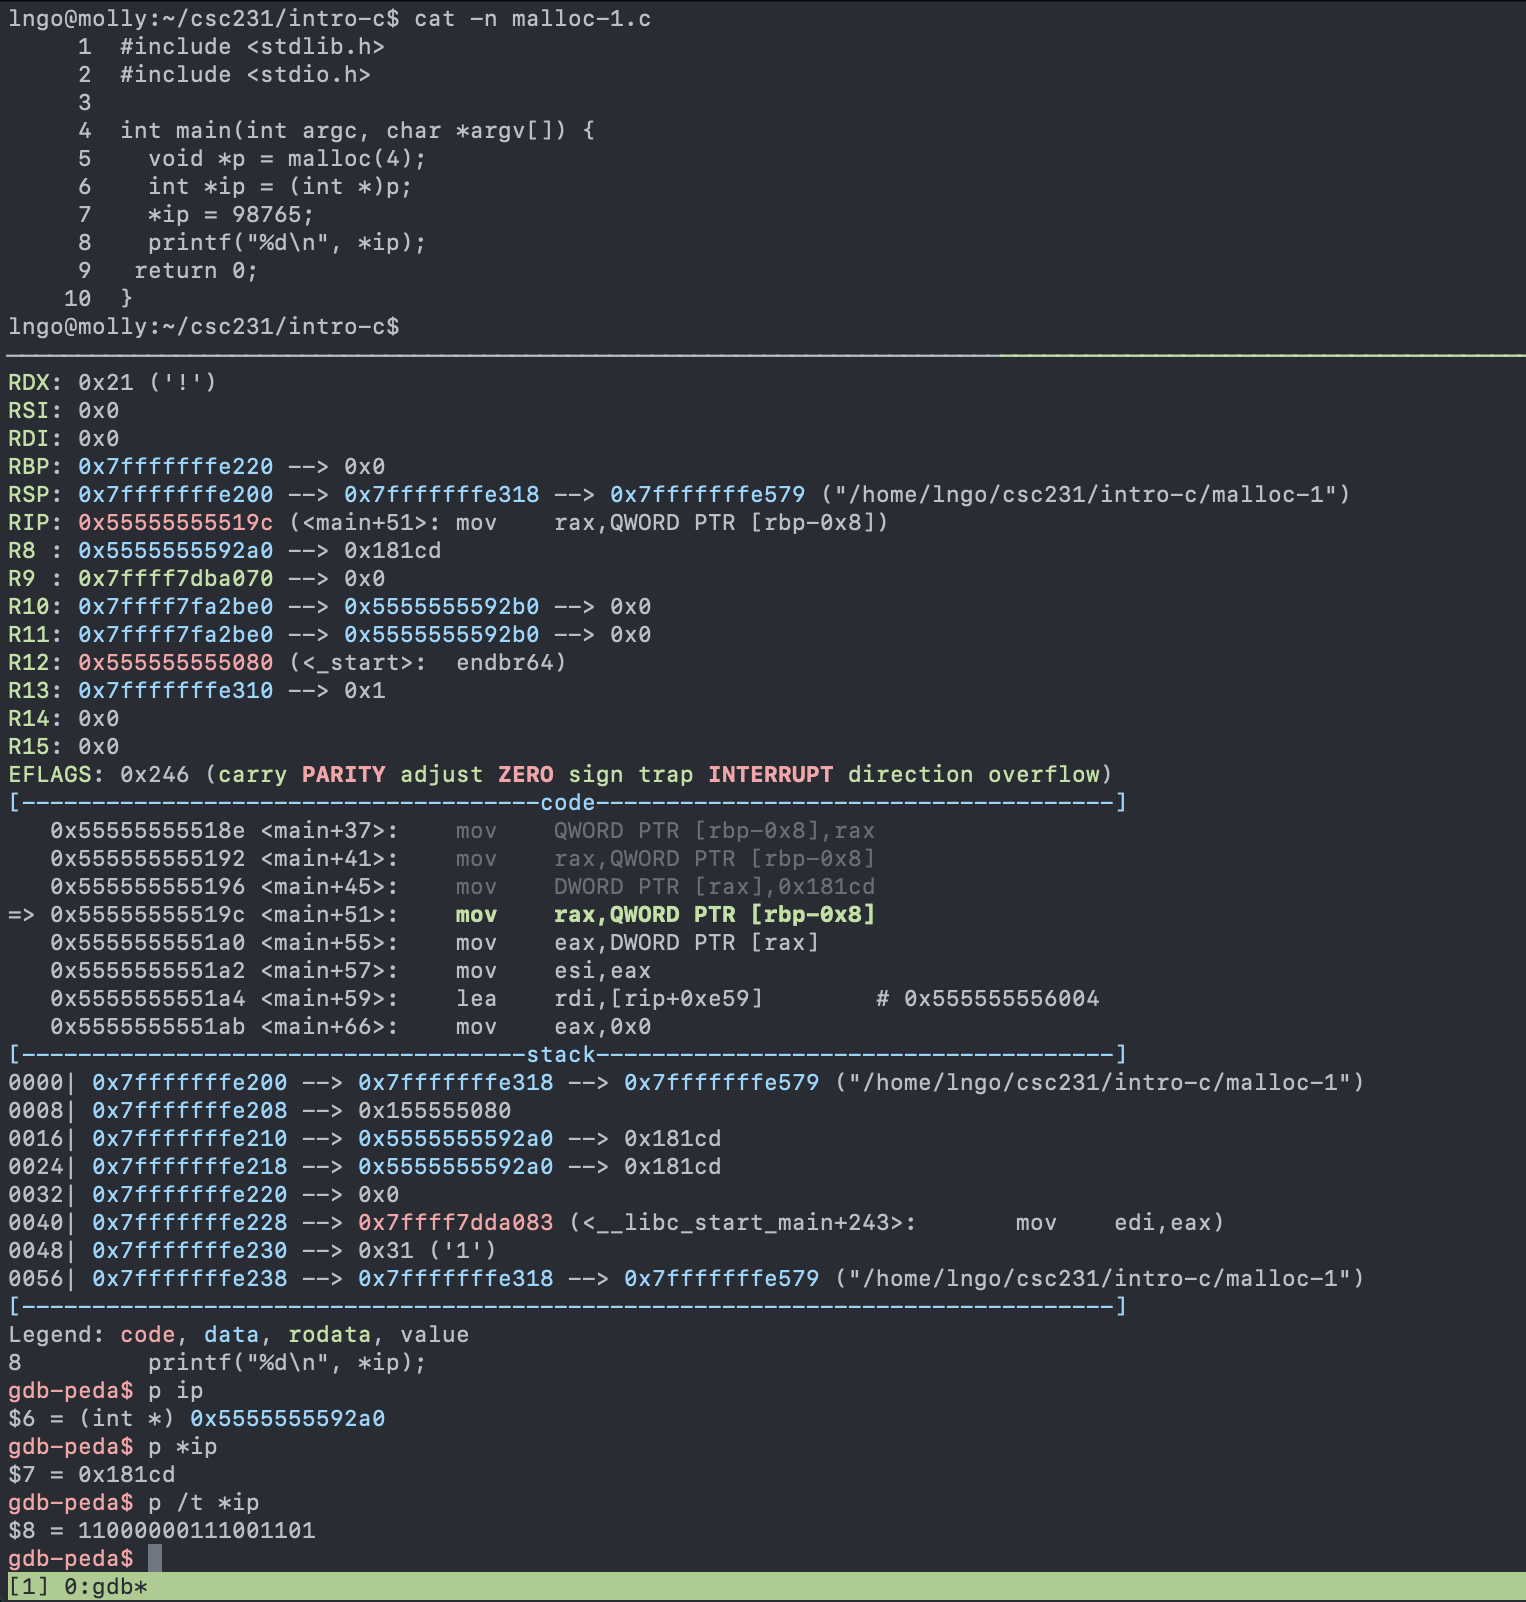
Type
nandEnterto run the next line of code:*ip = 98765;Type
p ip: what is the printed value?Type
p *ip: what is the printed value?Type
p /t *ip: what type of data is value? what is the corresponding value in decimal?
After running *ip = 98765;
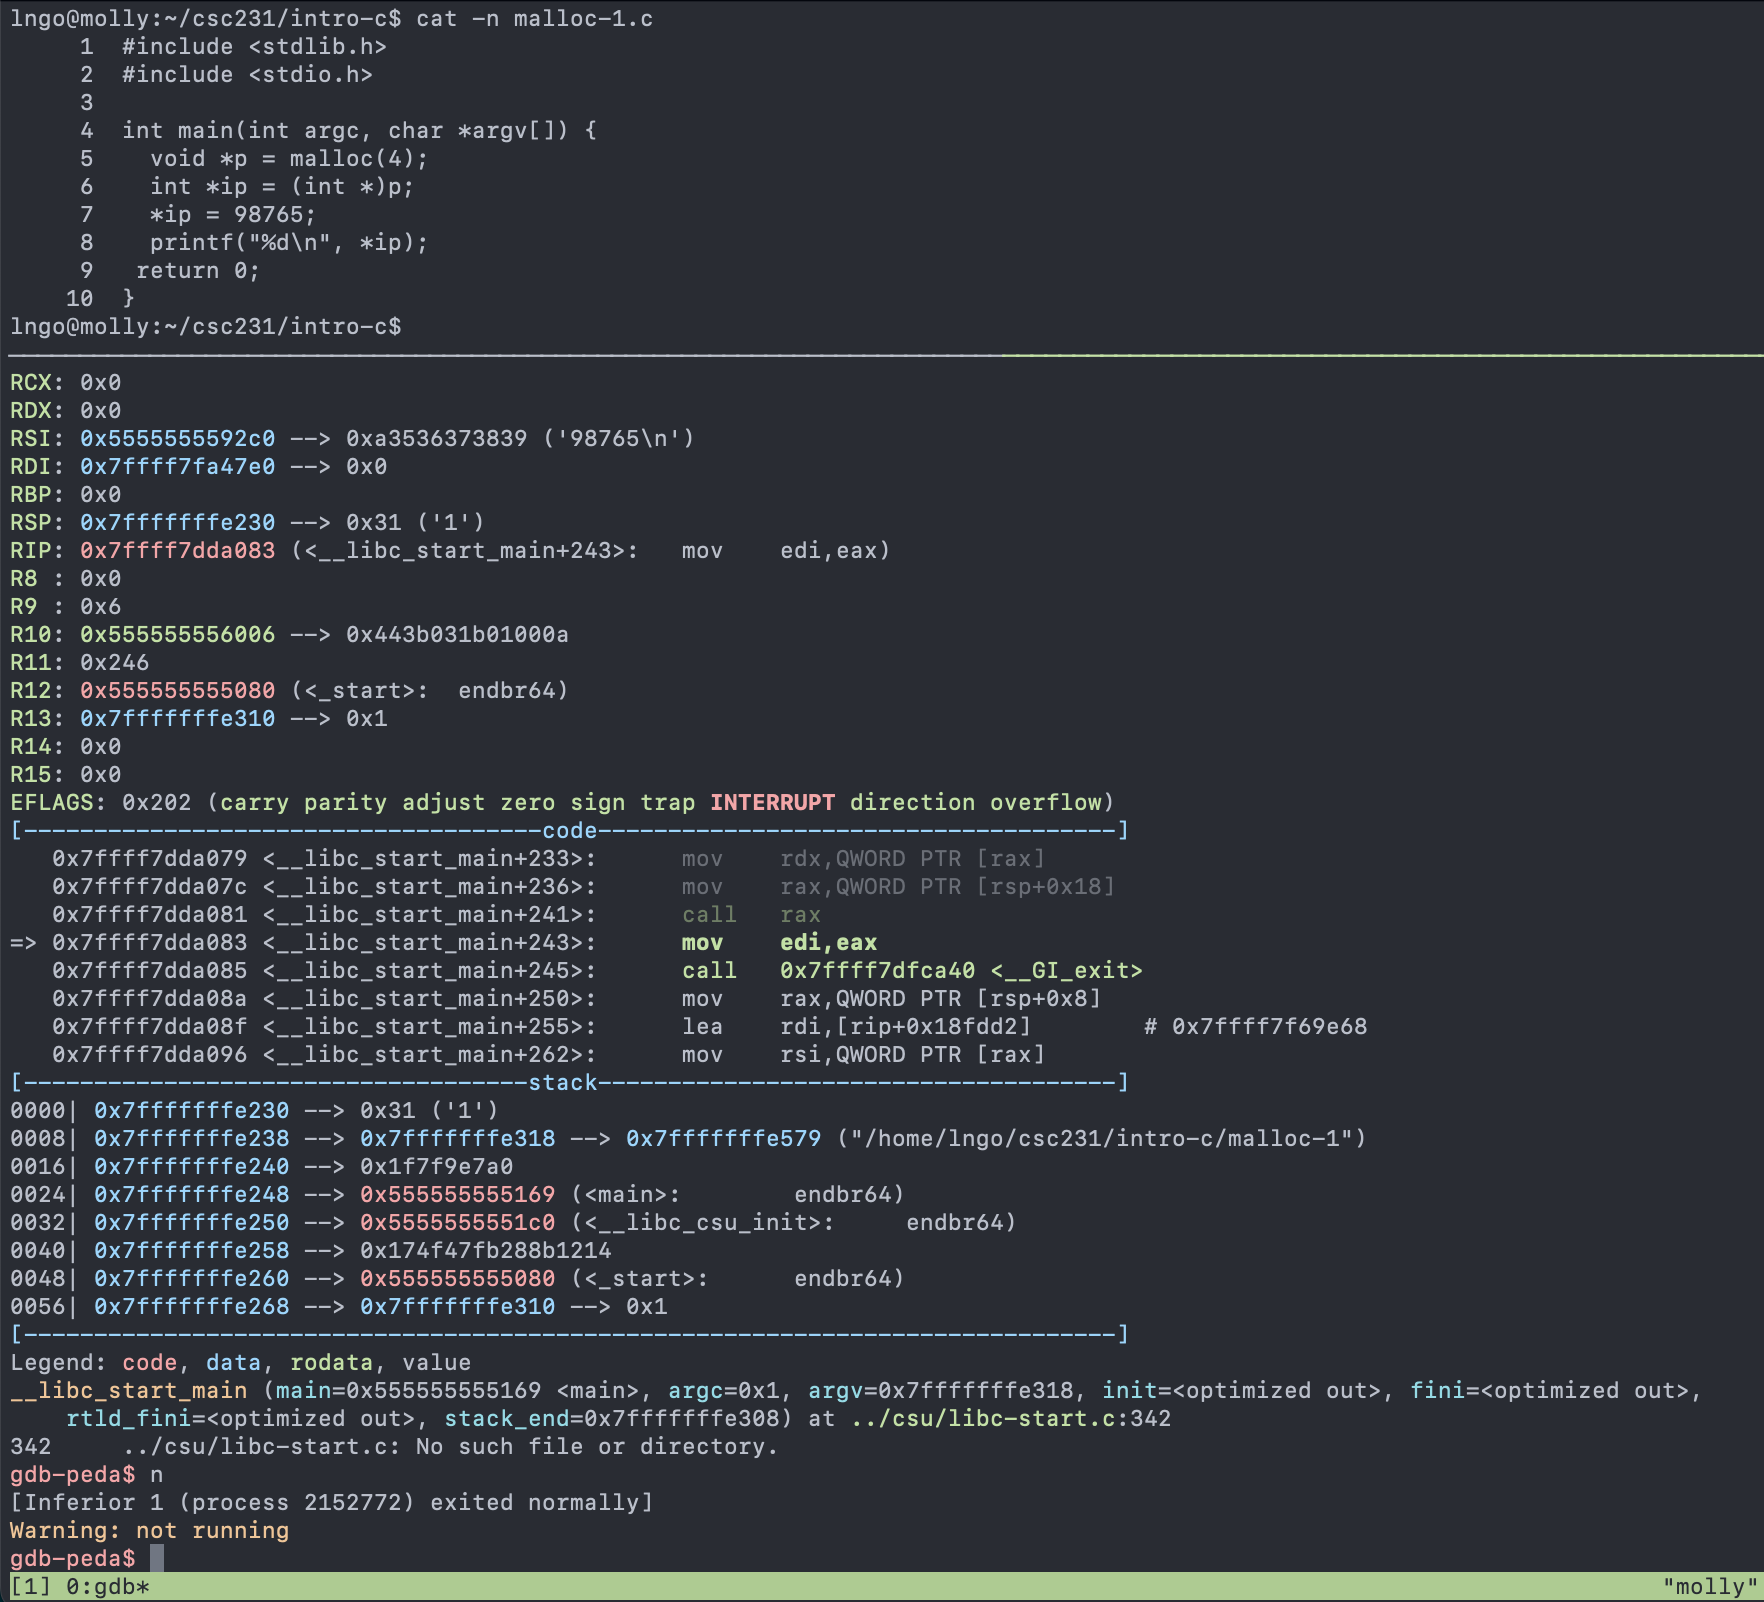
Keep hitting
nuntil you finish stepping through all the remain lines of code.
After finish
Examining contents of program while debugging array-4.c
In the top pane, compile
array-4.cin debugging mode.
gcc -g -o array-4 array-4.c
cat -n array-4.c
In the bottom pane, quit the current gdb session and rerun it on the recently created
array-4executable as follows:
gdb array-4
gdb-peda$ b main
gdb-peda$ run
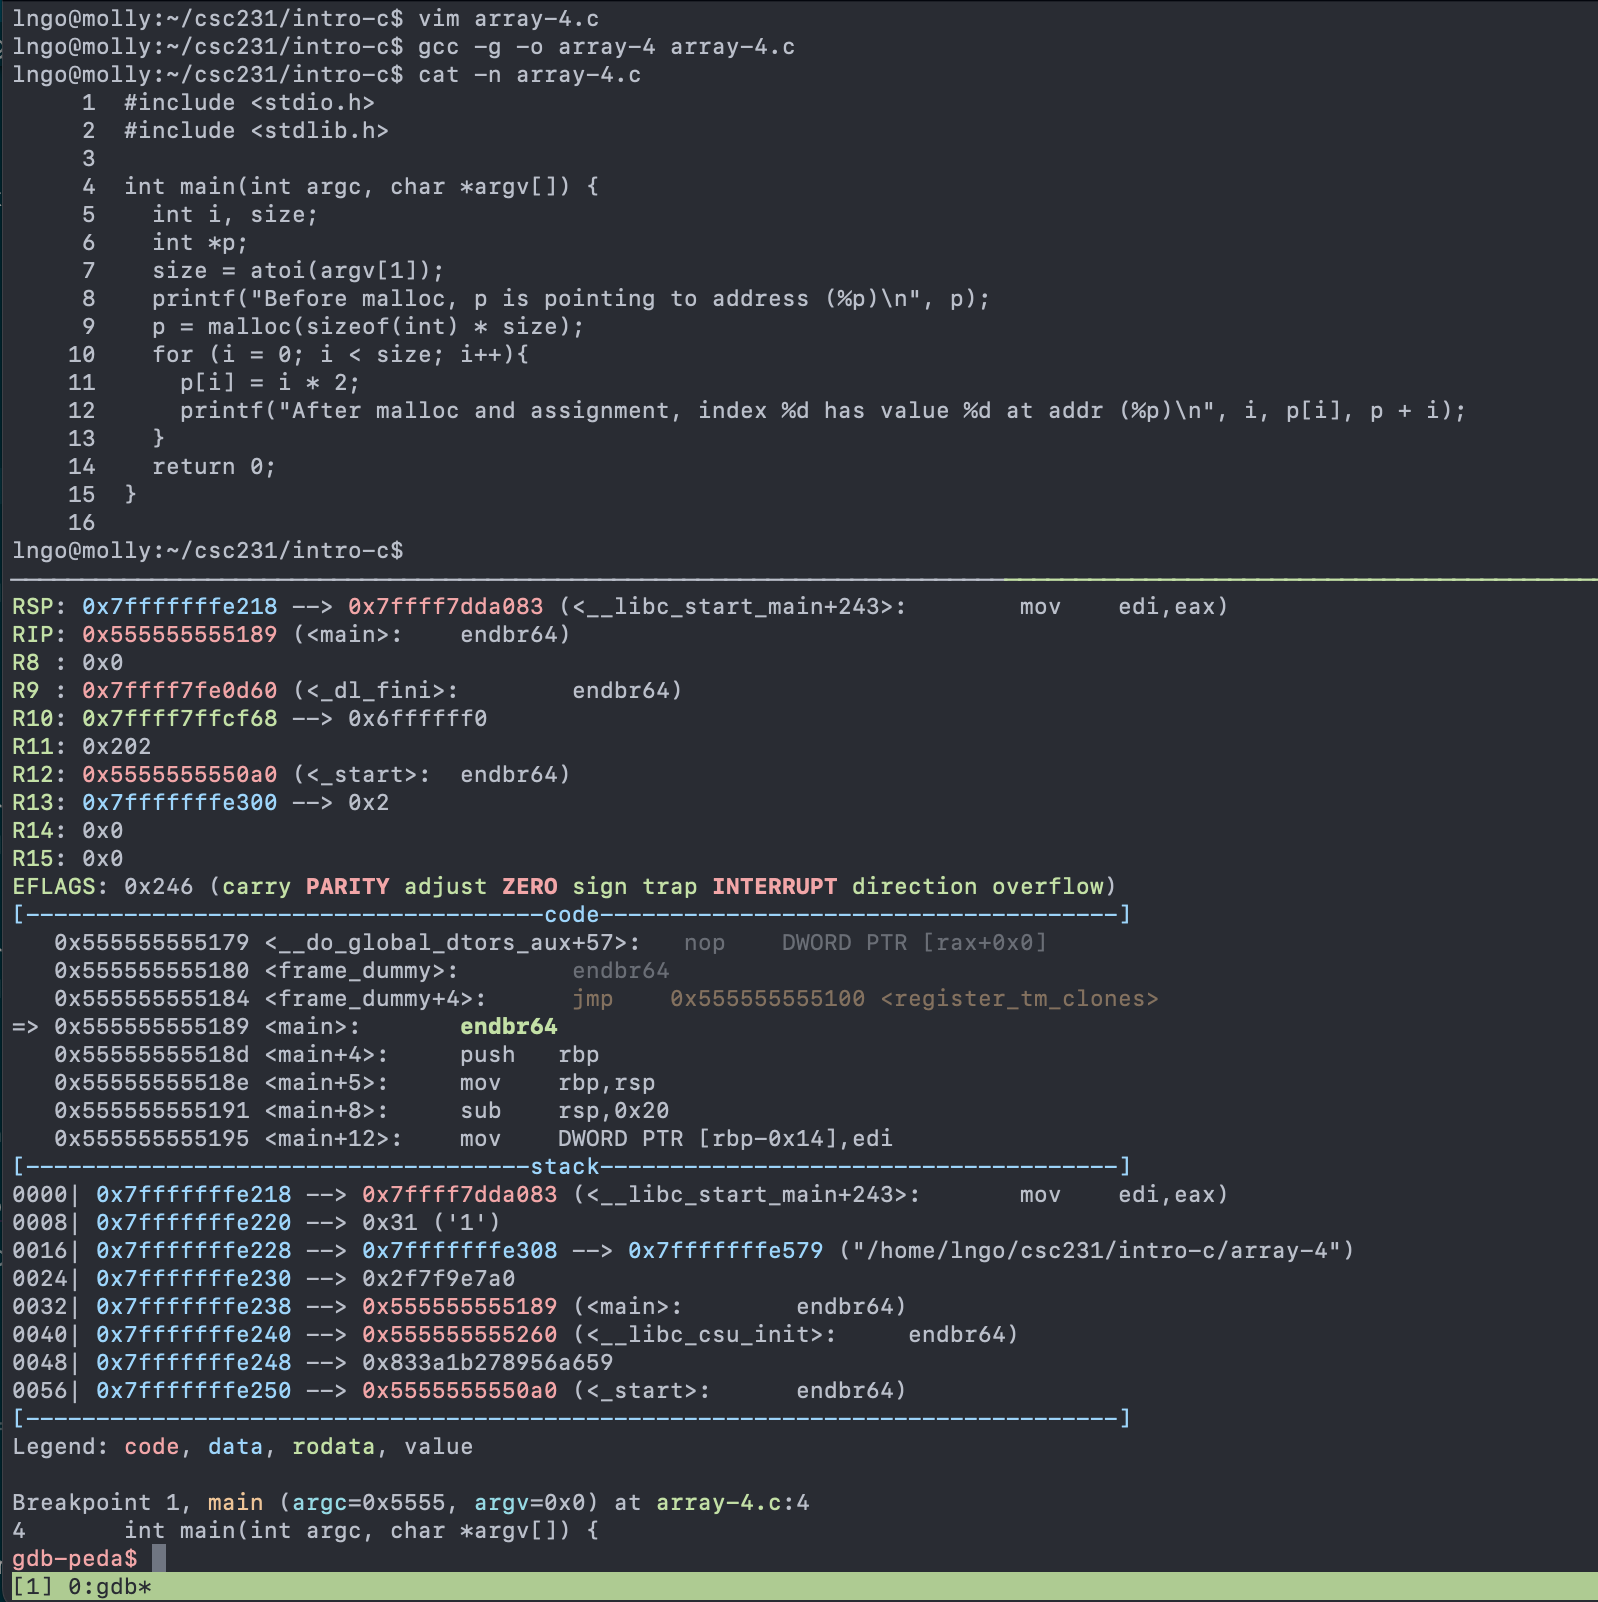
After initial run command

The next line of code to be run is
int main(int argc, char *argv[]) {Type
nandEnterto run the next line of code:int main(int argc, char *argv[]) {Run the following commands and observe the outcomes:
p argcp argv[0]p argv[1]p argv[2]p argv[3]p argv[4]…
After running int main(int argc, char *argv[]) {
![After running int main(int argc, char *argv[]) {](../_images/array-02.png)
Type
nandEnterto run the next line of code:size = atoi(argv[1]);Observe that dreaded
Segmentation faultnotice:SIGSEGVType
qto exitgdb.
After running size = atoi(argv[1]);
![After running size = atoi(argv[1]);](../_images/array-03.png)
Rerun gdb on
array_4executable as follows:
gdb array-4
gdb-peda$ b main
gdb-peda$ run 3
After initial run command
The next line of code to be run is
int main(int argc, char *argv[]) {Type
nandEnterto run the next line of code:int main(int argc, char *argv[]) {Run the following commands and observe the outcomes:
p argcp argv[0]p argv[1]p argv[2]p argv[3]…
After running int main(int argc, char *argv[]) {
![After running int main(int argc, char *argv[]) {](../_images/array-05.png)
Type
nandEnterto run the next line of code:size = atoi(argv[1]);Run the following commands and observe the outcomes:
p sizep &size
After running size = atoi(argv[1]);
![After running size = atoi(argv[1]);](../_images/array-06.png)
Hands on: finish running array-4
Use
nto run the next two lines (printf...andmalloc..).Step through the
forloop and printing out values ofi,p[i],&p[i], andp + iat every iteration.Make sure that you understand the lines of code that cause these variables to change value.
Utilize scrolling as needed.